


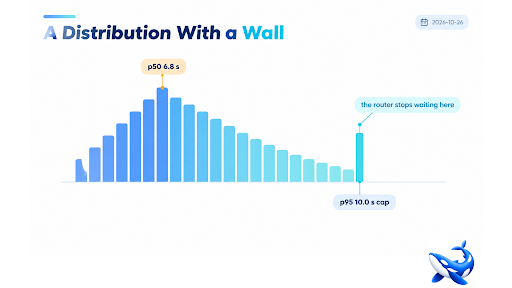
Kimi K3.1 Pro’s median time to first token on our route is 6,752 milliseconds over a seven-day window, with a p95 of 10,000 milliseconds [OURS]. Those two numbers are not the same kind of measurement, and reading them as if they were is how teams end up with timeouts tuned to a wall they never see. The p95 is exactly round because it is a ceiling: our routing layer stops waiting at ten seconds. The p50 is a real measurement of a real fleet. OrcaRouter‘s Kimi K3.1 Pro API card publishes both figures, at the vendor’s list rate, alongside the throughput figure that matters more for long answers.
This is the least glamorous article in this series and possibly the most operational, because latency is the property that decides whether a model is usable in a product regardless of how it scores.
The profile
| Metric | Kimi K3.1 Pro | Kimi K3 | Source |
| p50 time to first token | 6,752 ms | 4,680 ms | Ours, 7-day |
| p95 | 10,000 ms (cap) | 10,000 ms (cap) | Ours, 7-day |
| Output throughput | 52.4 tok/s | 28.8 tok/s | Ours, 7-day |
| Error rate | 0.064% | 0.070% | Ours, 7-day |
| Output speed (evaluator’s provider) | 57.5 tok/s | — | Independent |
| Speed on a data benchmark | 64 tok/s (median 72) | — | Independent |
| Time per index task | 845.6 s | — | Independent |
Four things to notice.
The new model is slower to start and much faster to finish. p50 rose from 4.68 to 6.75 seconds while throughput nearly doubled, from 28.8 to 52.4 tokens per second. For a 500-token answer that combination is roughly a wash; for a 5,000-token answer the new model is far quicker end to end.
Throughput is the number that governs perceived speed on long outputs. With reasoning always on (default `max`), answers are long. A 3,000-token answer at 52 tok/s takes about a minute of streaming, and the first-token delay is a rounding error next to that.
The independent evaluators agree on throughput and disagree on nothing that matters. AA measures 57.5 tok/s on its provider; a private data benchmark measured 64 tok/s against a 72 tok/s median across 34 models [INDEPENDENT]. Three measurements, three fleets, one band. Treat 50–65 tok/s as the model’s shape and your provider’s number as the one that applies to you.
The error rate is low and worth respecting. 0.064% is good. At a million requests that is still 640 failures, and a naive retry policy at that volume can spend more on cache writes than it saves.
Why the p95 is a wall
A routing layer that waits forever is a routing layer that hangs. Ours caps at ten seconds and returns an error or a fallback, which means:
- The p95 tells you the cap, not the tail. The real distribution of slow requests is truncated at ten seconds, and a request that would have taken fourteen is recorded as a timeout at ten.
- A p95 at the cap means at least 5% of requests are hitting it. That is what a three-day window at exactly 10,000 ms means. On this model, one request in twenty is running into the ceiling.
- Your own timeout should be below ours, not above. If your client waits twenty seconds for a route that gives up at ten, your users wait ten seconds for an error they could have received immediately.
The trend worth watching
The daily p50 over the window: 6,546 ms on 24 October, 6,897 ms on 25 October, 7,426 ms on 26 October [OURS]. Three days, a 13% drift upward, no model change.
That pattern has two readings and both are worth checking. The benign one is load: the model’s traffic roughly doubled in those three days, and a shared fleet serving more concurrent requests inevitably slows per-request. The less benign one is that the vendor’s serving path is degrading under the new model’s load — more reasoning tokens per request, longer sequences, more contention in the batching scheduler.
The test is easy: watch the same p50 after the traffic plateaus. If it settles back toward six and a half seconds, it was load. If it continues up, capacity is the story and the model’s stated 52 tok/s is optimistic for your peak hours.
Planning a deployment around this
Stream, always. A six-second first-token delay feels broken; a six-second spinner followed by a token every 20 milliseconds feels like a machine thinking. Every client you use should stream, and the first visible token should be something — even a status line — within a second.
Set timeouts from the work, not from the p50. Interactive completion: 30 seconds, which covers a normal answer at this throughput. Long generation: two to five minutes, because a 5,000-token answer with reasoning takes that long and the ceiling on output is far higher than most teams ever set.
Budget the reasoning time. Effort defaults to `max`, and the evaluator’s per-task time is 845.6 seconds — fourteen minutes for an Intelligence Index task, which includes long reasoning sequences and many turns [INDEPENDENT]. Nothing about that is a bug; it is what maximum effort over a 36:1 read-to-write workload looks like. If fourteen minutes is unacceptable, effort is the lever, not the model.
Fail over on the first token, not on completion. A route that hangs is worse than one that errors. With a second model on the same key, a six-second timeout to first byte with a fallback to a faster sibling converts a tail-latency problem into a slightly-worse-answer problem.
Measure your own p50 weekly. Our number describes our fleet at our load. The model will be faster or slower on yours, and the only number that matters for your timeout is the one you measure. Measure it weekly, not once.
The summary
Kimi K3.1 Pro is a deliberate model: six and three-quarter seconds to first token, then about 52 tokens a second, with one request in twenty running into a ten-second ceiling on our route. It is slower to answer than its predecessor and faster to finish, which is the right trade for long answers and the wrong one for chat. Plan for streaming, set timeouts below the router’s, and treat any latency figure — ours, the evaluator’s, or a vendor’s — as a property of a fleet on a day rather than of a model.
Sourcing note: the p50, p95, daily trend, throughput and error rate are OrcaRouter’s seven-day routing telemetry ending 26 October 2026, and the p95 is our routing layer’s ten-second ceiling rather than a measured percentile of the underlying distribution. The 57.5 tok/s, 845.6-second task time and 64-versus-72 tok/s comparison are Artificial Analysis and Plotly measurements respectively. Effort defaults are Moonshot’s documentation. Timeout and failover recommendations are ours.
